

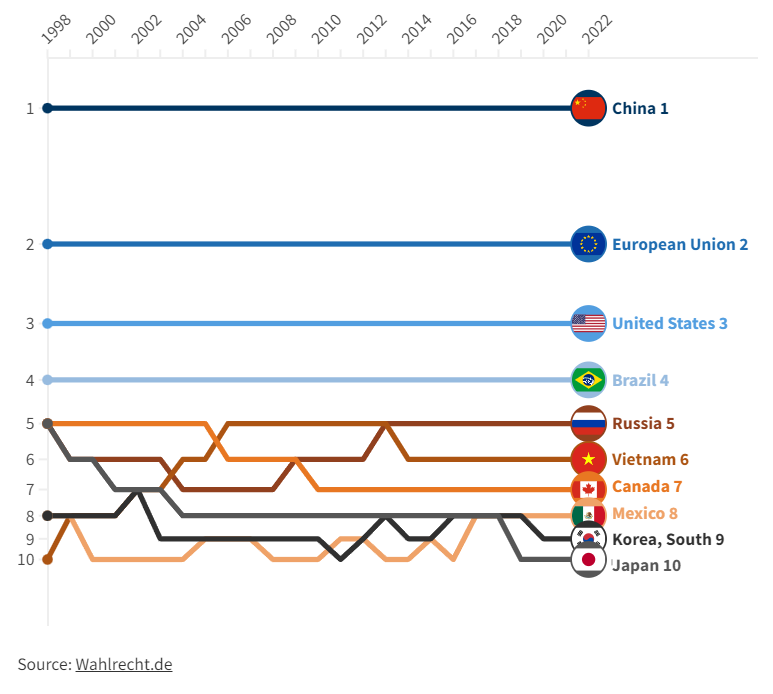
We observed sustained growth in China until the appearance of African swine fever in 2018 and how, after a spectacular drop, pork production has been recovering.
Regarding the ranking of the top-producing countries, we see there has been no movement for the first four places in the last 25 years if we consider the EU as a whole. We observe how russia and Vietnam were climbing positions against Canada.
This changes when we break the EU into countries (Figure 2), where Spain made a breakthrough in 2020, becoming the main EU producer, ousting Germany, which lost 20 years of hegemony, becoming the third world producer after China and the United States, until last year when it was overtaken by Brazil.
Given that the values for China distort the graph and do not allow us to appreciate the evolution in the other countries, below we have the same graph but without China and with the EU represented by the main producers (Spain, Germany, France, Poland, the Netherlands, Denmark, Italy, and Belgium), which represent approximately 86% of total EU production.
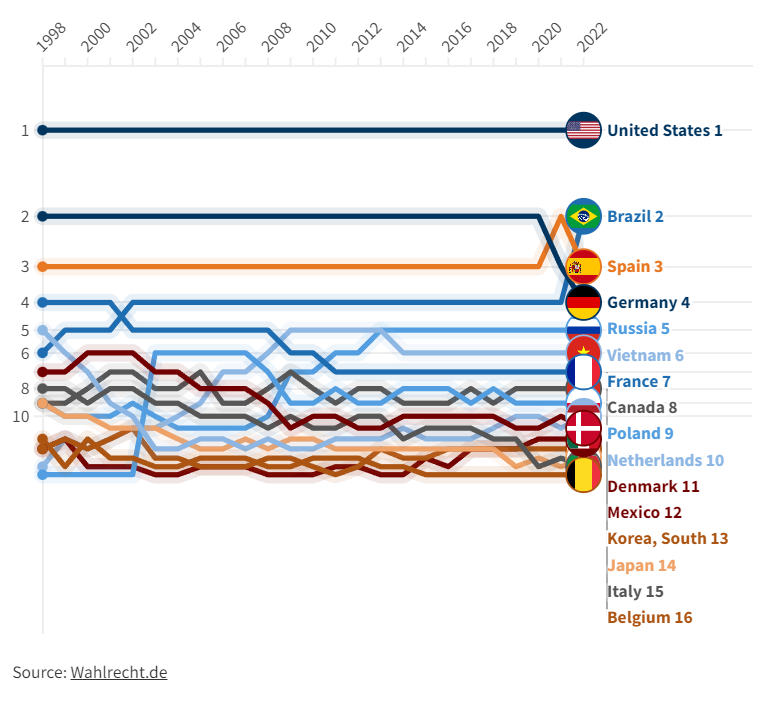
Figure 2. Evolution of pork production (Mt) and ranking over the last 25 years in the world's main producers (excluding China and including the main EU producers). Source: USDA and Eurostat.
PigUA.info by materials pig333.com